A swimlane diagram is a flow chart view that is divided into a number of horizontal or vertical ‘swimlanes’. It is often used to show how different roles or departments interact in a business process.
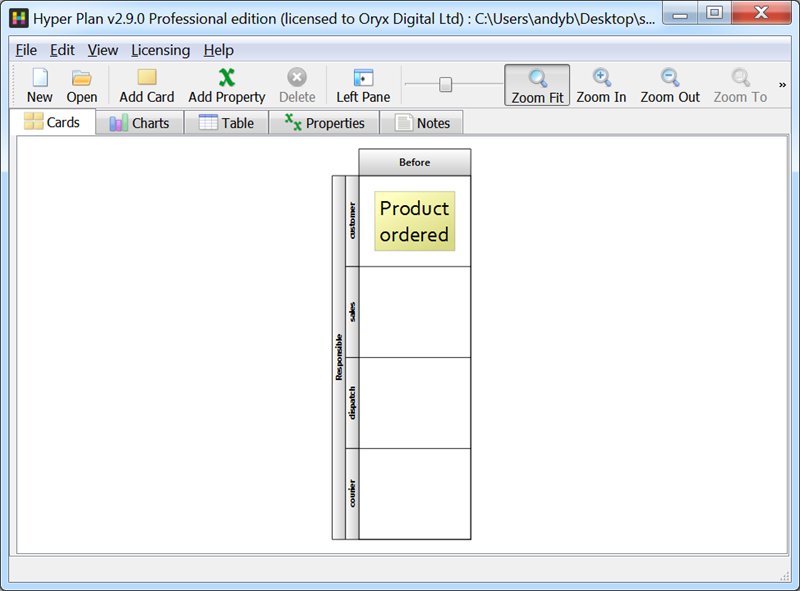
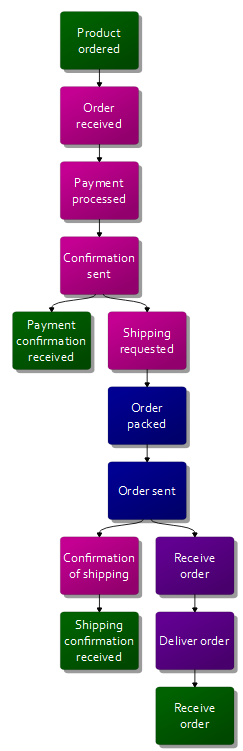
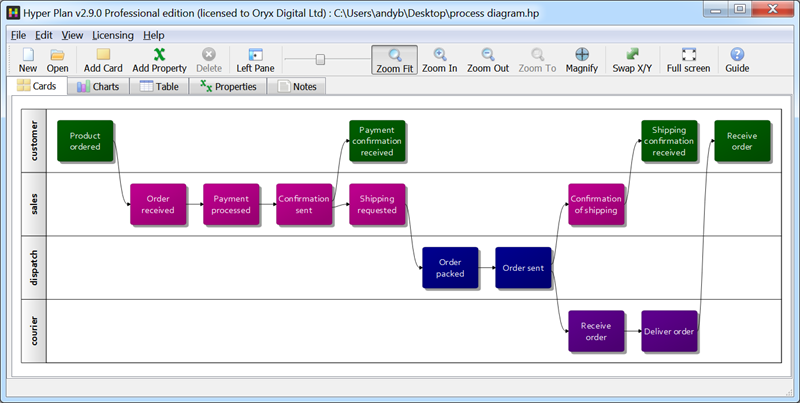 Example swimlane diagram
You can easily create swimlane diagrams on your Windows or Mac computer using Hyper Plan. Hyper Plan is inexpensive and much more powerful than a swimlane diagram template or generic drawing software. It also automatically lays the diagram out for you, saving a lot of time.
If you haven’t already got Hyper Plan installed, you can download a free trial here. It should only take you a minute to download and install. When you are prompted which edition of Hyper Plan to try, choose Professional Edition (dependencies between cards are not available in the Home edition). If you are already using the Home edition, you can switch to a trial of the Professional edition in the Edition tab of the Preferences window.
Start Hyper Plan. Create a new file by selecting File>New. Choose a name for the new plan file, e.g. “swimlane diagram”.
In the New Plan Properties window leave the Title property checked. Click the Add Property button and add a new property Responsible with Type set to Text, Display as set to Card rows and for Pre-defined values enter customer,sales,dispatch,courier.
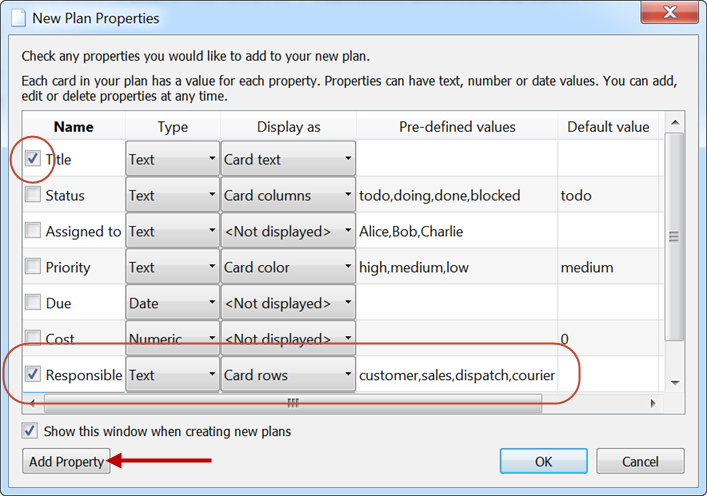
Click OK.
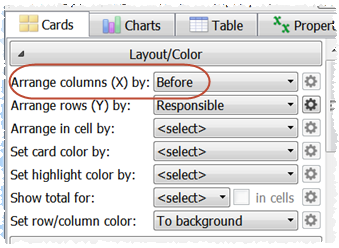
In the Layout/Color section of the Left pane set Arrange columns (X) by to Before.
Select View>Left Pane to hide the left pane.
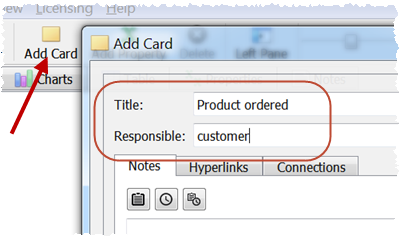
Now we can add a card for the first process step. Click on the Add Card toolbar button, enter “Product ordered” for Title and select “customer” for Responsible. Click OK.
This card represents the first step in the business process. A single card should now be visible in the Cards pane.
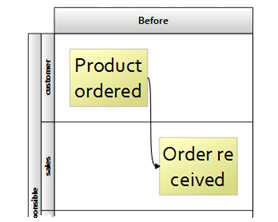
Hold down the keyboard Shift key and click on the new card. An arrow will appear. Then click on the “sales” row to create a new card in this row. Select ‘Before’ from the pop-up menu.
![]()
The Add Card window will appear. Set the Title as “Order received” and leave Responsible as “sales”. Click OK.
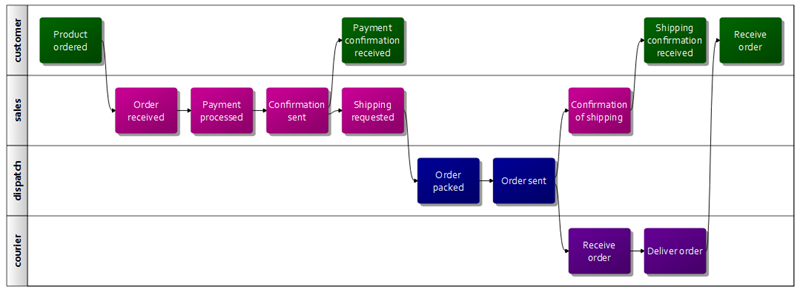
Continue adding cards and connections until you have something like the below image. It doesn’t matter if it isn’t exactly the same. You can Edit>Undo any mistakes.

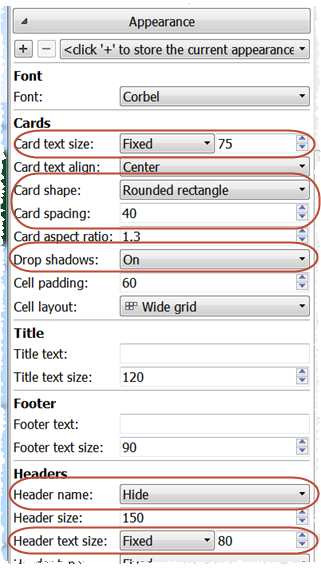
Now let’s tidy up the appearance. Select View>Left Pane to show the left pane and change the Appearance settings as shown below.
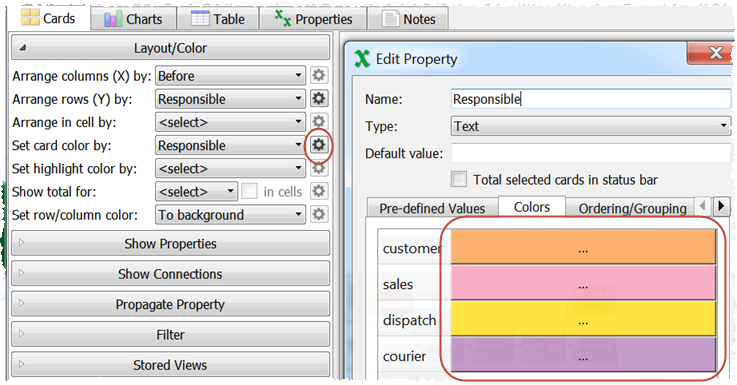
We can also color the cards by their “Responsible” value.
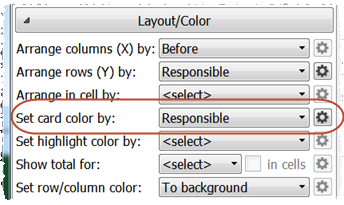
Click on the ‘cog’ button to change the colors.
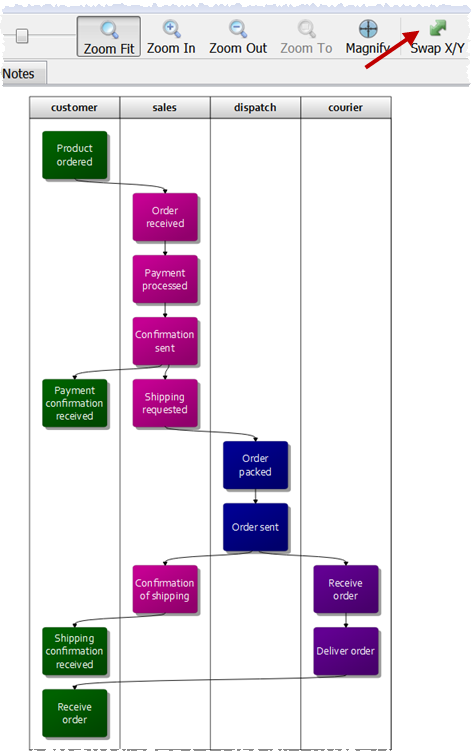
It should now look something like this:
Change the swimlanes to vertical by clicking on Swap X/Y.
Then collapse the swimlanes by changing Arrange columns (X) by to <select>.
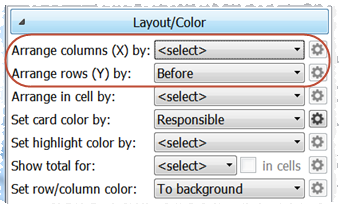
To get something looking like this:
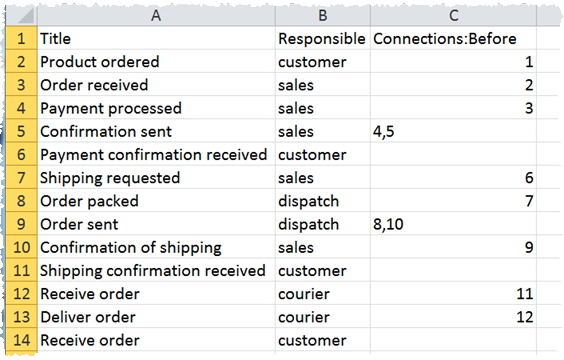
If you have your process information in a CSV file, you can import it so that you don’t have to re-type everything. Just select File>Open and set the file type to CSV Files. Note that you can File>Save As… from Microsoft Excel to create a CSV file.
Once you are happy with your swimlane diagram you can File>Print… or File>Export it.
Hyper Plan is very flexible. We have only scratched the surface of what it can do. Have a play!