An Interrelationship Diagram (also known as an Interrelationship Digraph) is a way to diagram the cause and effect relationships between issues, so that you can identify the root causes of a problem.
You can easily create an Interrelationship Diagram on your Windows or Mac computer using Hyper Plan software. Hyper Plan is inexpensive and much more powerful than a Interrelationship Diagram template or generic drawing software. It can also automatically layout the diagram for you, so that you can easily see the root causes.
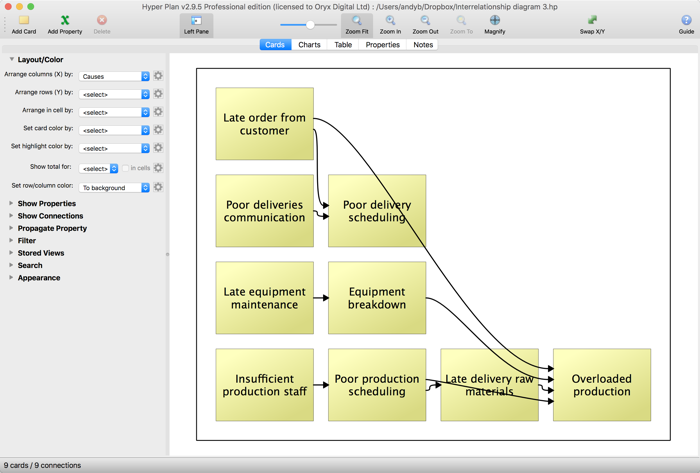 Example Interrelationship diagram
If you haven’t already got Hyper Plan installed, you can download a free trial here. It should only take you a minute to download and install. When you are prompted which edition of Hyper Plan to try, choose Professional Edition (connections between cards are not available in the Home edition). If you are already using the Home edition, you can switch to a trial of the Professional edition in the Edition tab of the Preferences window.
Start Hyper Plan. Create a new file by selecting File>New. Choose a name for the new plan file, e.g. “Interrelationship Diagram”.
In the New Plan Properties window leave the Title property checked and uncheck the other properties.
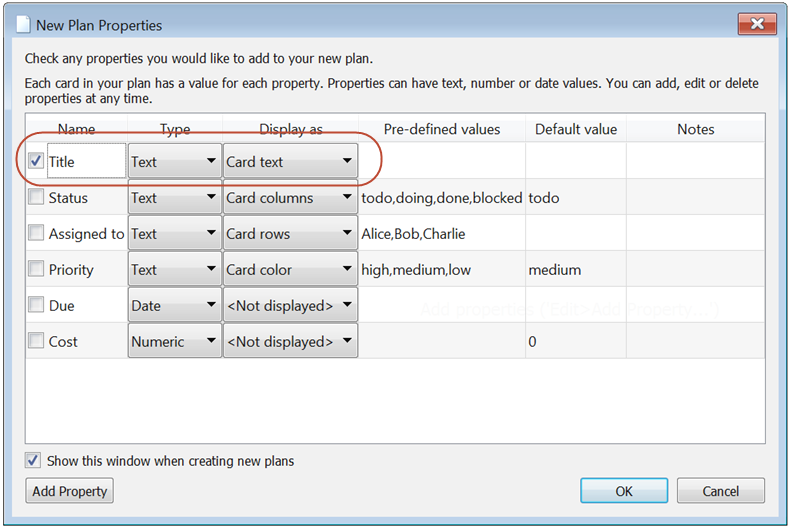
Click OK.
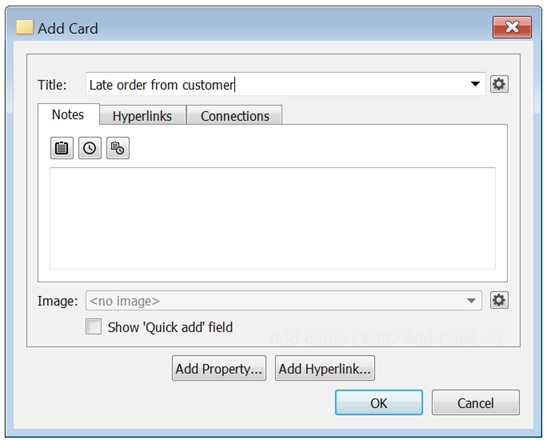
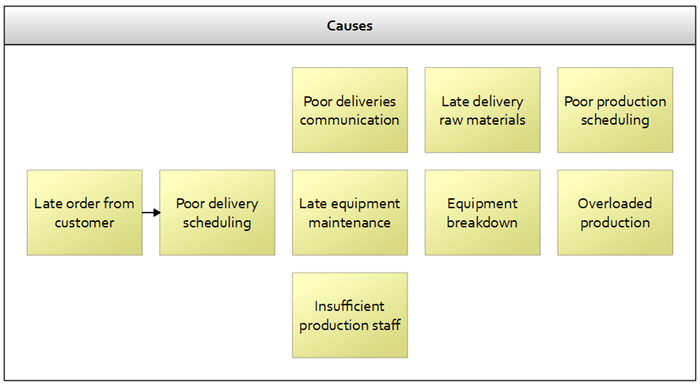
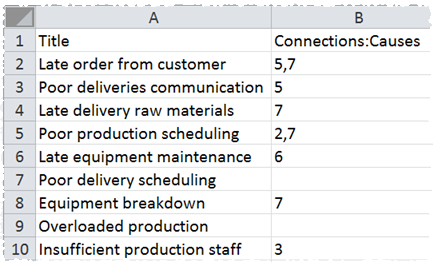
Lets create a simple Interrelationship Diagram to analyze causes of late deliveries. Click on the Add Card toolbar button, fill out the card as below and click OK.
A single card should now be visible in the Cards pane. Add some more cards as shown below. The order you add them isn’t important.
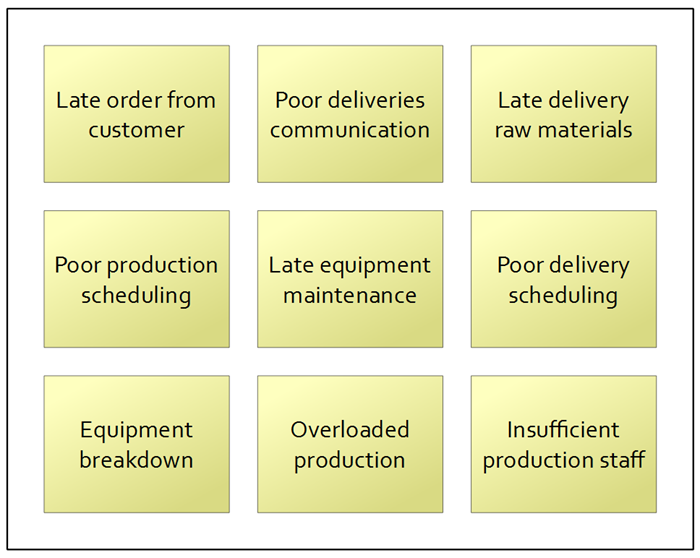
Note that you can also add cards by holding down the Alt key (Windows) or Option key (Mac) and clicking on the Cards pane.
Now select Edit>Connect Types… and rename the first connection type to Causes, as this is the type of connection we need for an interrelationship diagram.
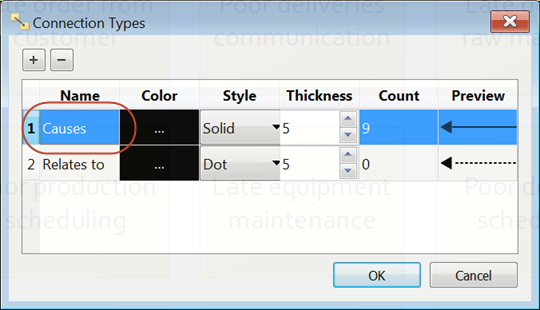
Click OK.
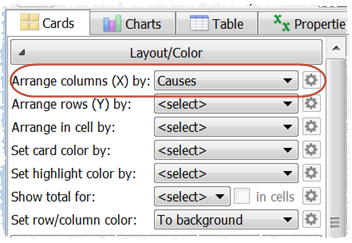
Now set Arrange rows (X) by in the left pane to Causes, as we want to layout the cards left-to-right by their cause-effect relationship.
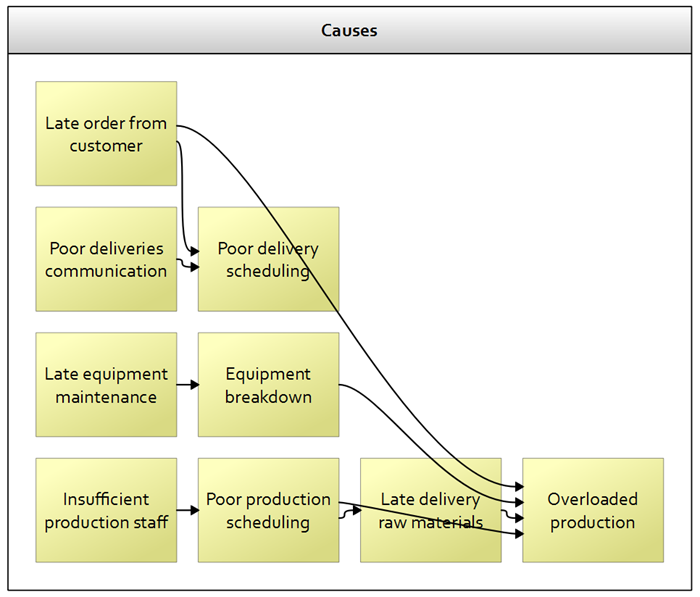
Now we need to connect the cards by their cause-effect relationship. Click on the Late order from customer card to select it. Select Edit>Add connection from the main menu and then click on the Poor delivery scheduling card. Select Causes from the pop-up menu. You should now get a Causes arrow between the two cards to show that late customer orders cause poor delivery scheduling.
Add additional cause-effect arrows, for example as shown below. The cards will be automatically moved so that the root causes (the ones with no input arrows) are moved to the left.
Note that you can also add arrows more quickly by Shift-clicking on the first card and then clicking on the second card.
This is only a very simple Interrelationship Diagram, but there is no limit to how many cards you can add. We could also add other types of relationship, additional card properties, notes, hyperlinks and images.
If you have your task information in a CSV file, you can import it so that you don’t have to re-type everything. You can even import the relationships. Just select File>Open and set the file type to CSV Files. Note that you can File>Save As… from Microsoft Excel to create a CSV file.
Once you are happy with your Interrelationship Diagram you can File>Print… or File>Export it.
Hyper Plan is very flexible. We have only scratched the surface of what it can do. Have a play!