An organization chart (sometimes called an org chart or organogram) is a useful way to show the structure of an organization. For example, to show who each member of staff in a company reports to. You can easily create organization charts on your Windows or Mac computer using Hyper Plan. It is much more powerful than a template or generic drawing software.
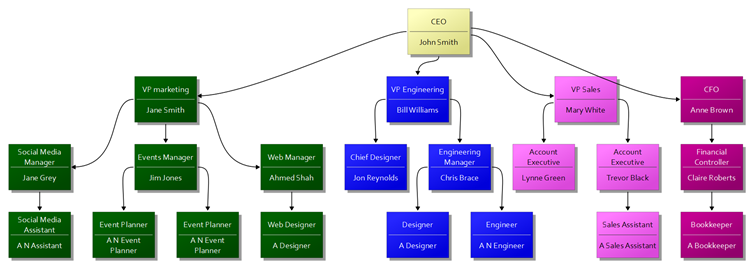 Example Organization Structure Chart
If you haven’t already got Hyper Plan installed, you can download a free trial here. It should only take you a minute to download and install. When you are prompted which edition of Hyper Plan to try, choose Professional Edition (links between cards are not available in the Home edition). If you are already using the Home edition, you can switch to a trial of the Professional edition in the Edition tab of the Preferences window.
Start Hyper Plan. Create a new file by selecting File>New. Choose a name for the new plan file, e.g. “Organization chart”.
In the New Plan Properties window leave just the Title property checked and click the Add property button. Now add a new property Staff name and select Card text from the Display as drop-down list.
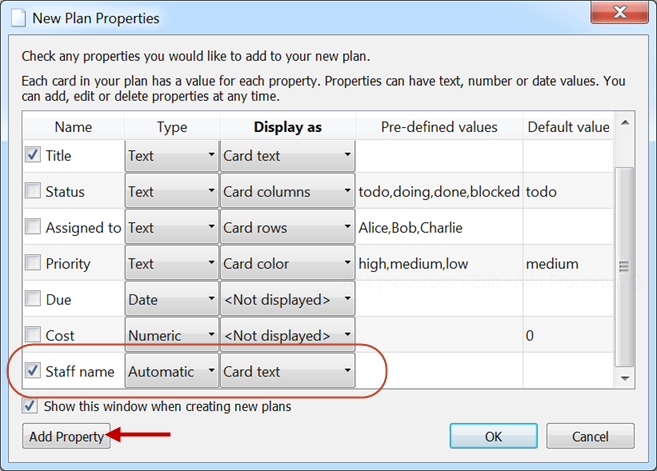
Click OK.
We need to set up a ‘Manages’ relationship. Select Edit>Connection Types… and change the name of the first connection type from Before to Manages.
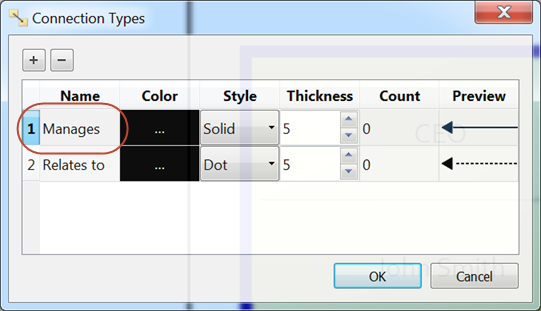
Click OK.
Now we need to add a card for each member of staff. Click on the Add Card toolbar button, fill out the card as below and click OK.
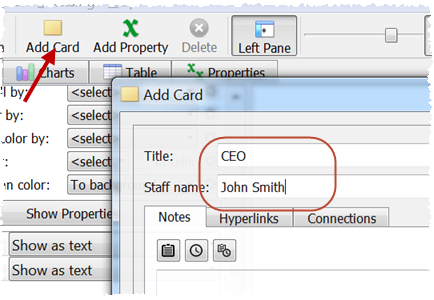
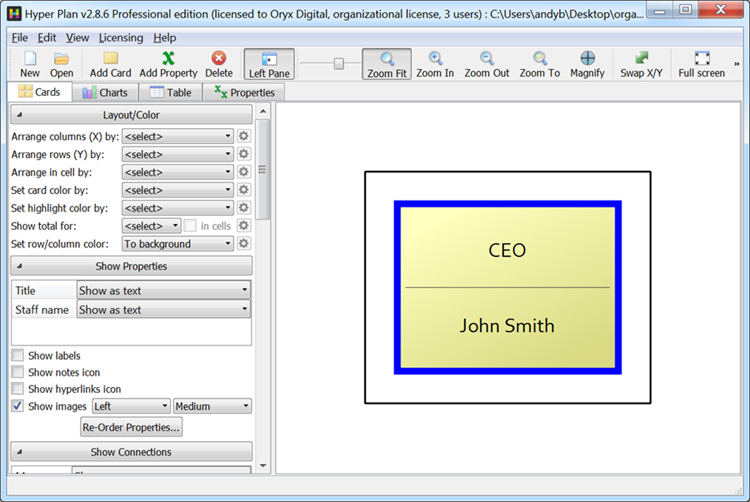
A single card should now be visible in the Cards pane.
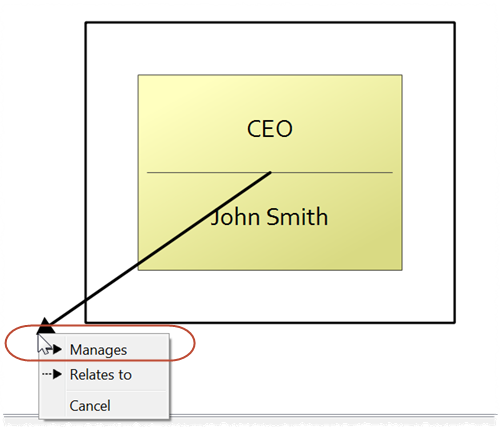
Now lets add a subordinate to the CEO. Hold down the Shift key, click anywhere on the CEO card and then click anywhere outside the CEO card. Select Manages from the menu.
The Add card window should appear. Enter another title and name, e.g. VP Marketing / Jane Smith, and click OK. You should now see 2 cards connected by an arrow.
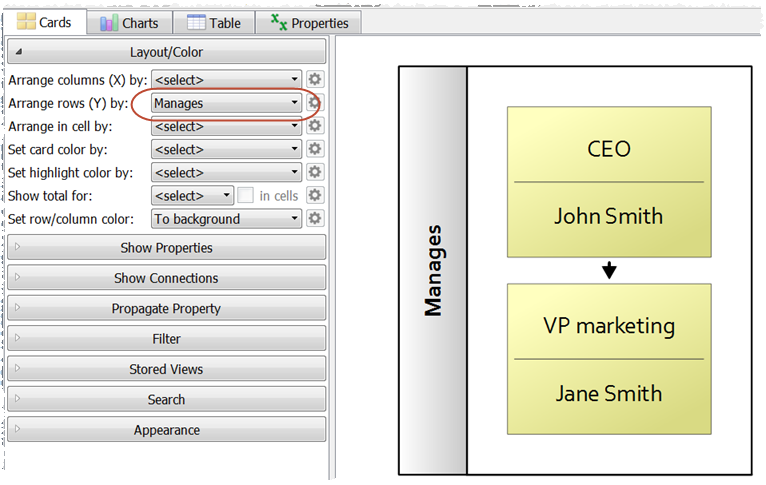
We want to automatically arrange the cards so that the CEO is at the top, so set Arrange rows (Y) by in the left pane to Manages.
Add cards for the other staff that report to the CEO by Shift-clicking on the CEO card and then clicking away from other cards.
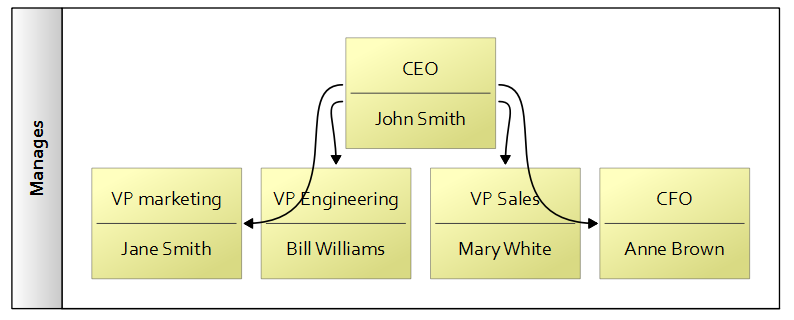
You can now add subordinates for the VP of marketing by Shift-clicking on that card. Continue with this process of adding cards for staff until you end up with something like the image below:

Note that you don’t have to worry about the positions of the cards, as they are laid out for you automatically, based on the relationships between the cards.
We can now tidy up the chart a bit in the Appearance section.
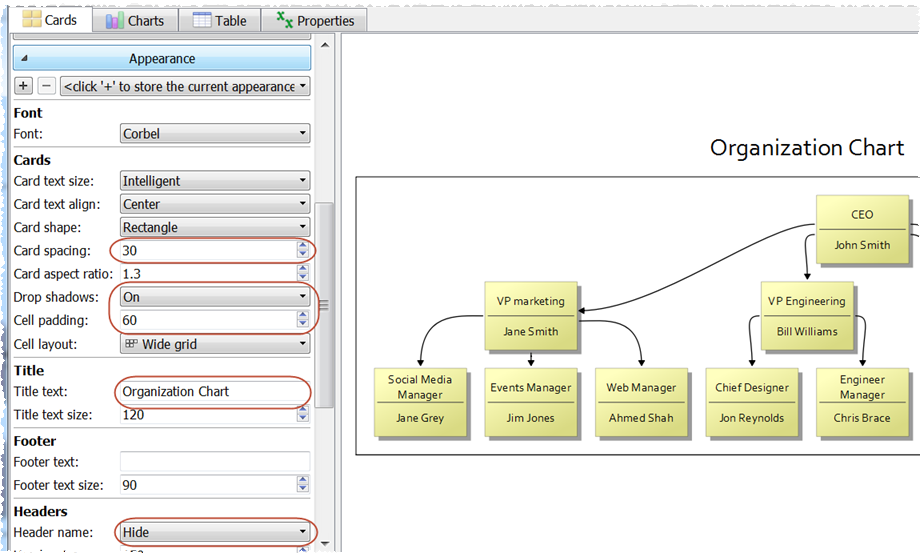
Lets also color code the cards by department. Select Edit>Add Property… and add a new property with name Department.
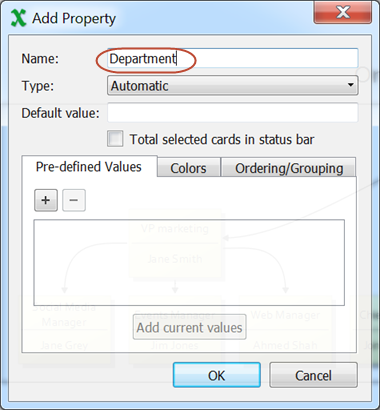
Click OK. Now drag a box around the VP of marketing and her subordinates.
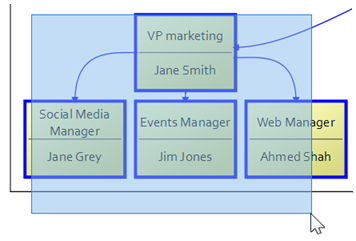
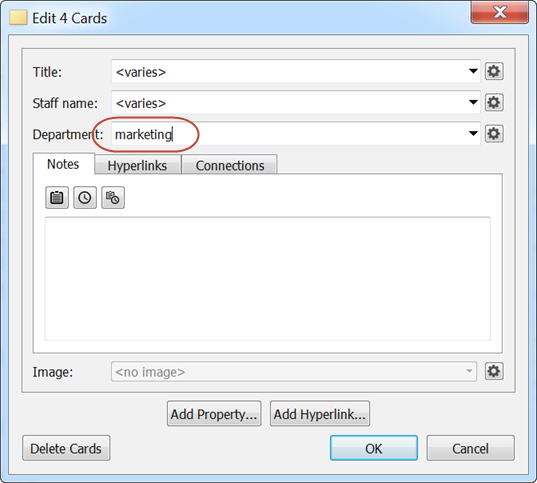
Then right click on one of the cards and select Edit 4 Cards….
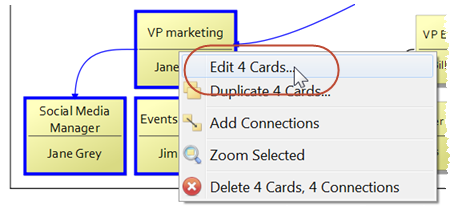
In the Department field type Marketing and click OK.
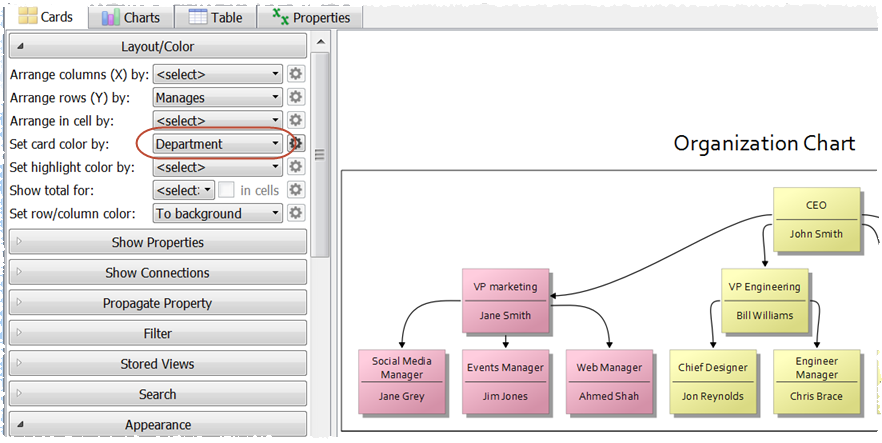
Then set the cards to be colored by department.
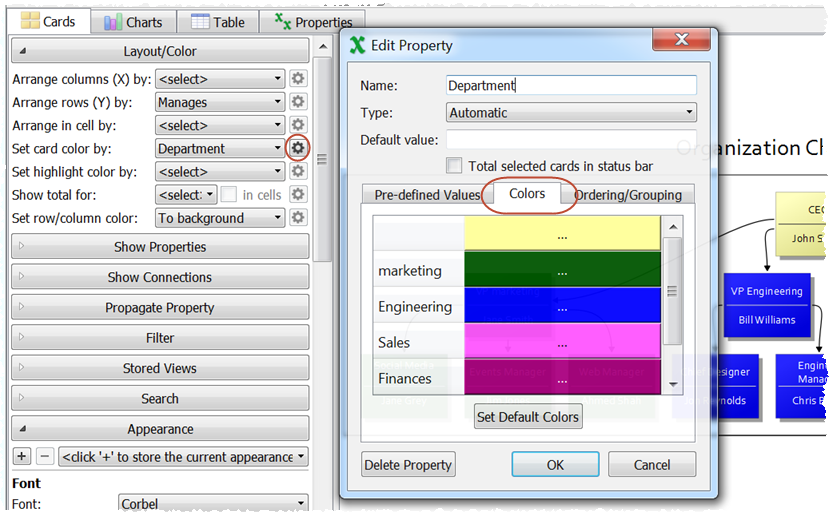
We can set the department property for the other cards. Changing the colors for the departments is easy.
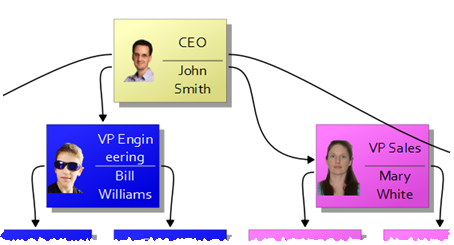
You can add as many other properties as you need: pay grade, date joined, grade at last status review. Whatever is important to you. You can also drag image files or images from a web browser on to cards.
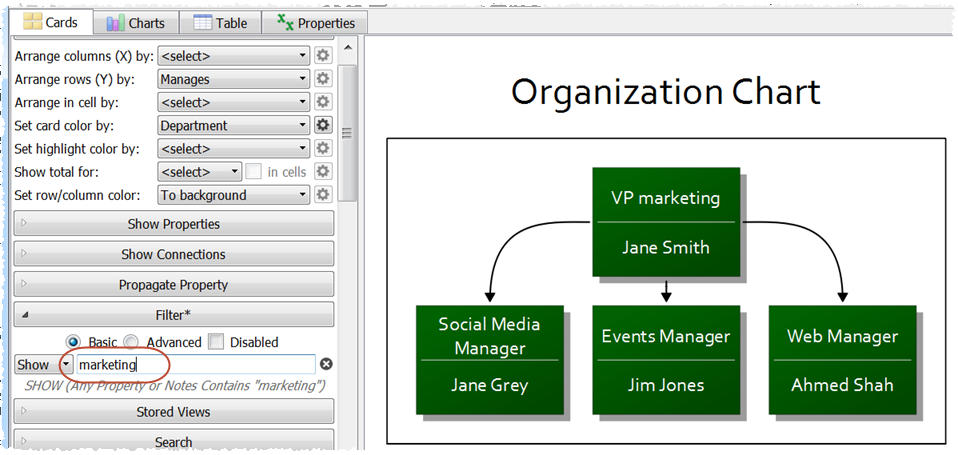
If you have a large organization chart you can use Hyper Plan’s powerful built-in filtering to hide the parts you aren’t interested in. For example, you can show just the marketing department.
If you have your staff information in a CSV file, you can import that so that you don’t have to re-type everything. Just select File>Open and set the file type to CSV Files. Note that you can File>Save As… from Microsoft Excel to create a CSV file.
Once you are happy with your organization chart you can File>Print… or File>Export it.
Hyper Plan is very flexible. We have only scratched the surface of what it can do. Have a play!