There is a limit to how well you can track your sales pipeline using a spreadsheet or sticky notes. For maximum power and flexibility you need sales pipeline software.
 Example sales pipeline
Hyper Plan is great for visualizing and tracking your sales pipeline. We’ll take you through a simple example.
If you don’t already have Hyper Plan installed, you need to download and install the free trial. This should take about a minute.
Lets start with a new plan. If you don’t already have an empty plan, select File>New to create a new plan file. Choose an appropriate name and location for the plan file.
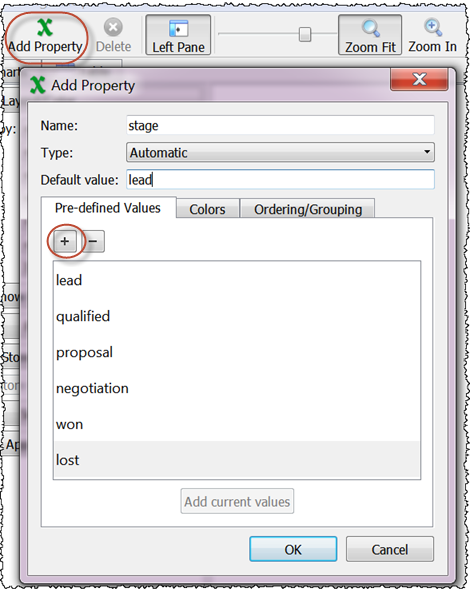
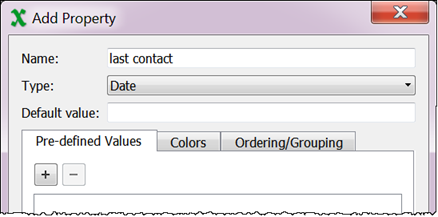
Select Edit>Add Property… (or click the Add Property toolbar button) and add a ‘stage’ property. Click the + button in the Pre-defined values tab to add the different stages shown below.
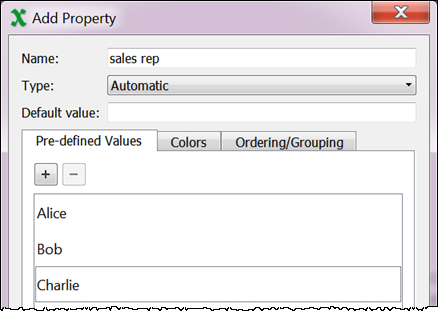
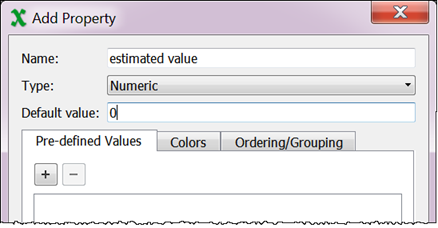
Click OK. Repeat the process to add ‘sales rep’, ‘estimated value’ and ‘last contact’ properties, as below.
Now we can add some cards to represent sales prospects. Select Edit>Card…, fill out the card as below and click OK.
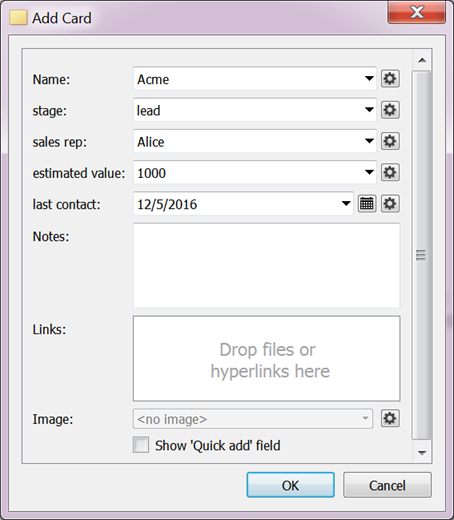
Note that we are using the ‘name’ property for the customer name.
If you click on the Table tab you will see the data that you have entered. Add some more cards until the Table pane looks as below. It doesn’t matter if yours is a little different.
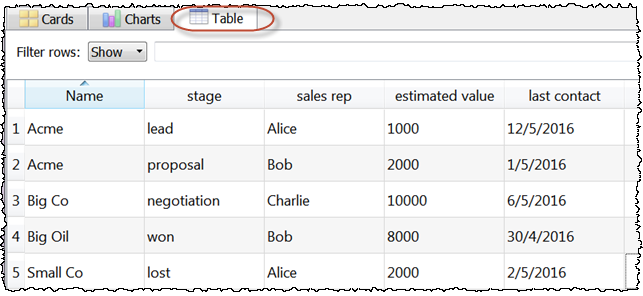
Note that Hyper Plan saves changes automatically. No need to click on a ‘save’ button.
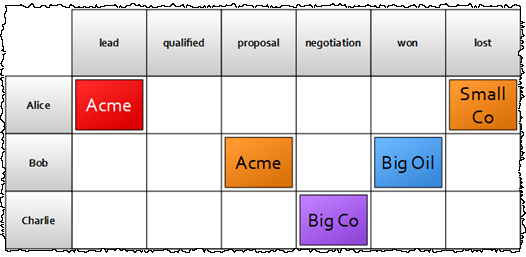
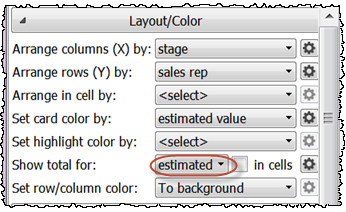
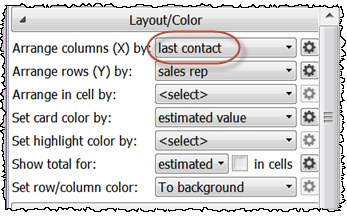
Click on the Cards tab and change the Layout/Color section of the left pane as shown below:
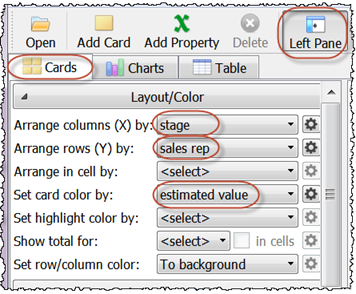
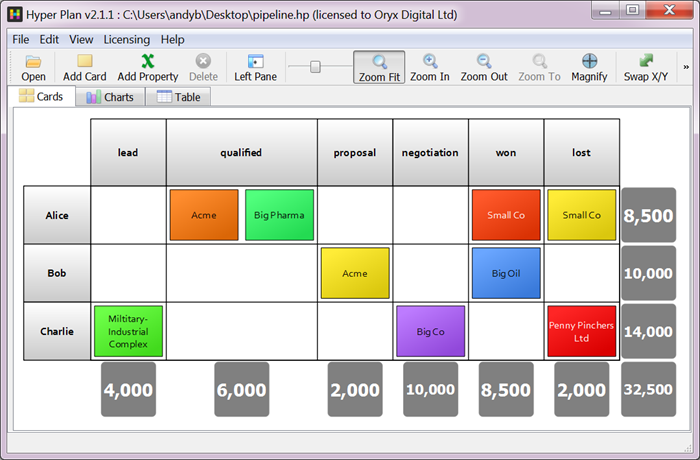
The cards should now be laid out by stage and rep and colored by estimated value.
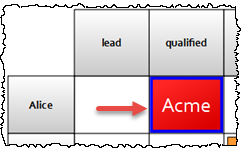
To change the stage of a card just drag it to a different column.
We can show estimated value totals by stage and rep. This is like an Excel pivot table, but much easier!
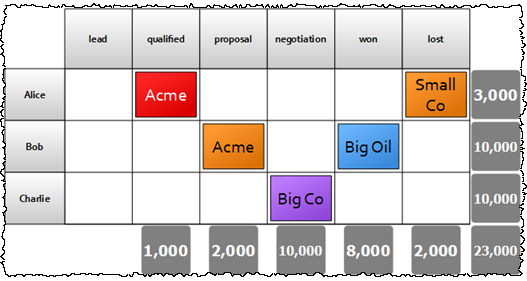
Note that the totals update if you drag cards to different rows or columns.
Now lets change it to lay out the cards in a timeline by last contact.
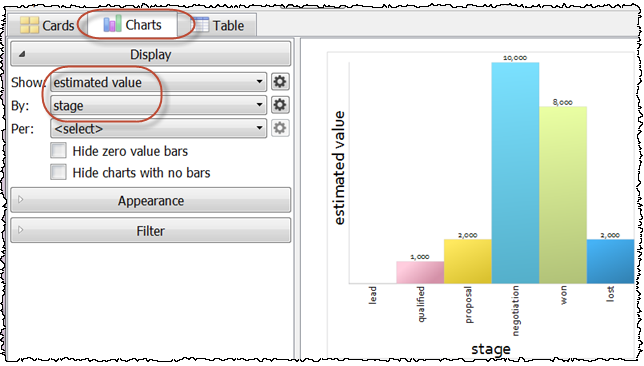
We can also create a chart with a few clicks in the Charts pane:
This is a simple example to give you an idea of what Hyper Plan can do. For tracking a real sales pipeline we might also want to additional properties such as ‘expected close date’, ‘product’, ‘sales area’, ‘customer contact’ etc.
If you already have your sales data in a spreadsheet, then you can export it to a .csv file and import the .csv file straight into Hyper Plan. No need to re-type everything.