This guide covers features found only in Hyper Plan Professional Edition. It should be read in conjunction with the Home Edition Quick Start Guide.
Connections can be used to model sequencing, dependencies, hierarchy and other types of relationships between cards. They are only available in Hyper Plan Professional Edition. If you don’t have a Professional Edition license key you can try the Professional Edition by selecting Professional in the Edition tab of the Preferences window. You can experiment with connections using the PERT chart, work breakdown structure, process diagram and organization chart sample plans installed with Hyper Plan.
Connection types
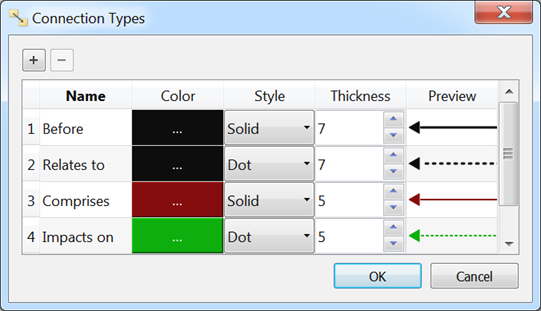
You can edit the available connection types by selecting Edit>Connection Types… or clicking the Connection Types… button in the Show Connections section of the Cards pane. Add as many connection types as you like.
Adding connections
You can start a connection between cards in the Cards pane in any of the following ways:
- Shift-click on a card.
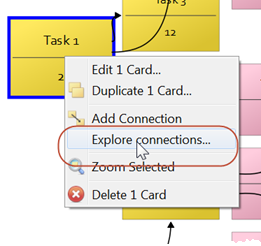
- Select one or more cards and then choose Add Connection from the Edit or right-click menu.
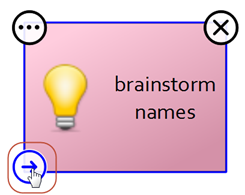
- Click on an Add connection card overlay item (if View>Icon Overlay is checked).
An arrow will then be drawn from the selected card(s) to the mouse cursor. Click on another card to add a connection from the original card(s). Click away from existing cards to add a new card with a connection from the original card(s).
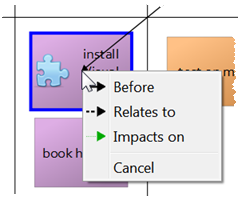
Only currently visible connection types can be added. If more than one connection type is visible, you will be prompted which one to add.
Press Escape to cancel adding the connection.
Managing connections
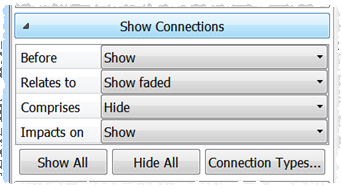
Each connection type can be shown, shown faded or hidden in the Show Connections section of the Cards pane.
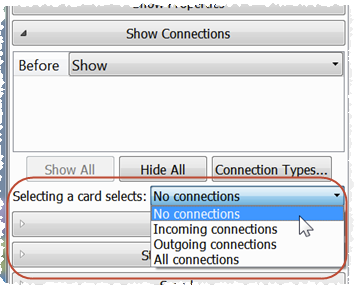
When a card is selected any visible connections can optionally be selected. This makes it easier to see which other cards it is connected to.
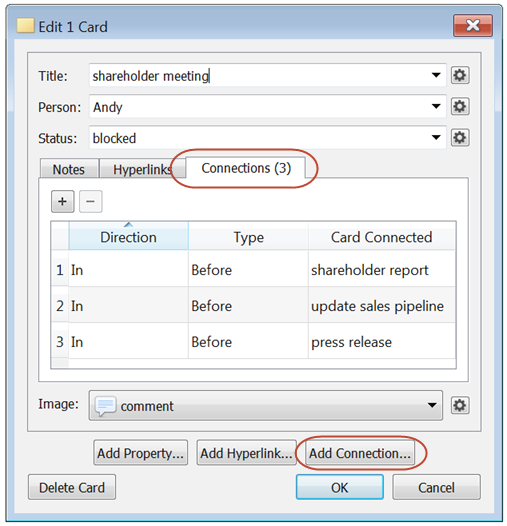
Connections can be seen and edited, in the Add Card and Edit Card windows:
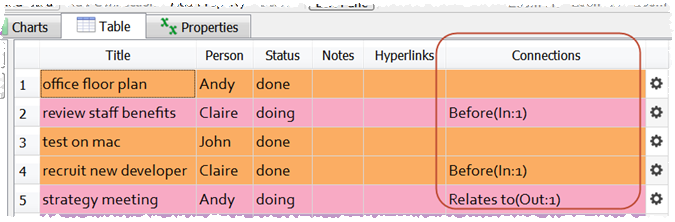
And seen in the Table pane:
To delete a connection, just select it and then choose Edit>Delete or press the Delete or Backspace key. Selecting a connection can be tricky if you are zoomed out of a large plan. So you may need to zoom in and click on the arrow head. You can also left-click and drag out a box to select connections.
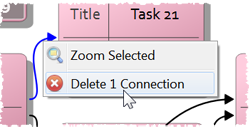
Right-clicking on a connection in the Cards pane shows a context menu.
The number of connections is shown in the status bar.
Layout by connections
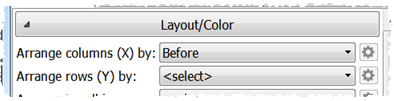
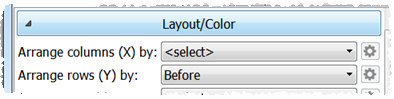
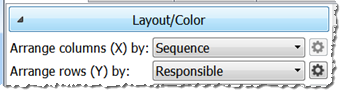
You can layout cards by their connectivity in the Cards pane. Select the connection type in the Arrange columns (X) by or Arrange rows (Y) by fields of the Layout/Color section of the Cards pane.
Horizontal layout:
Vertical layout:
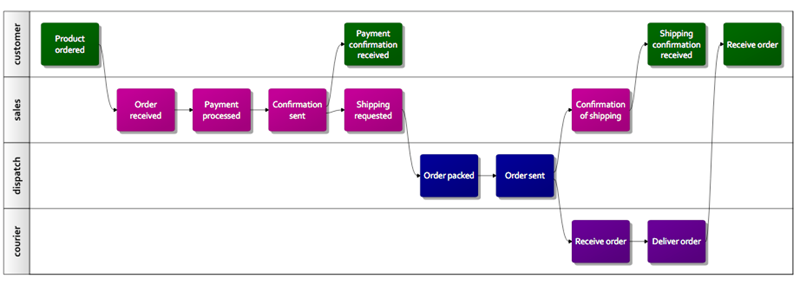
You can also layout by connections and properties:
The ‘children’ of each card are shown in the order set by the Arrange in cell by field.
Depending on the aspect ratio of the cards, you may need to increase the Card spacing field in the Appearance section of the Cards pane for clarity and aesthetics.
Only visible connections are used in the layout (e.g. not connections where the connection type is hidden or where the card at either end is hidden by filtering). Unconnected cards are grouped on the right/bottom. The layout algorithm works best with trees (e.g. where every card has only 1 inward connection, apart from ‘root’ cards which have none), but can handle graphs (e.g. where cards can have multiple inward connections), including graphs with cycles (e.g. A connects to B, B connects to C and C connects to A). Note that it isn’t possible to layout the cards so that every connection goes left to right/top to bottom (a ‘topological ordering’) if there are cycles.
The ability to layout by connectivity or property opens up some interesting capabilities. For example the ability to switch easily between a modern Kanban view and a classical PERT chart using stored views.
Visualizing connections
Hyper Plan allows you to visualize complex connectivity in a dynamic and easy to understand form.
To access this feature select a single card in the Cards or Table pane and then select Explore Connections… from the main Edit menu or a right-click menu.
The selected card is shown in the center of the display. The cards in the first ring are arranged, where possible, so that incoming connections are to the left and outgoing connections to the right. The appearance of the cards is taken from the Appearance section in the Cards pane.
Click any other card to move it to the center. Click the Back, Forwards or Home buttons to navigate through the history as you would with a web browser (use the Left arrow, Right arrow and Home keyboard keys as shortcuts). If you are on a Mac without a Home key, use Fn+Left arrow.
You can change the depth of connections shown using the Depth control (use the Up arrow and Down arrow keyboard keys as shortcuts). The cards get smaller as you increase the depth, so you will probably find depths greater than 3 are only useful for seeing the overall shape of the connectivity.
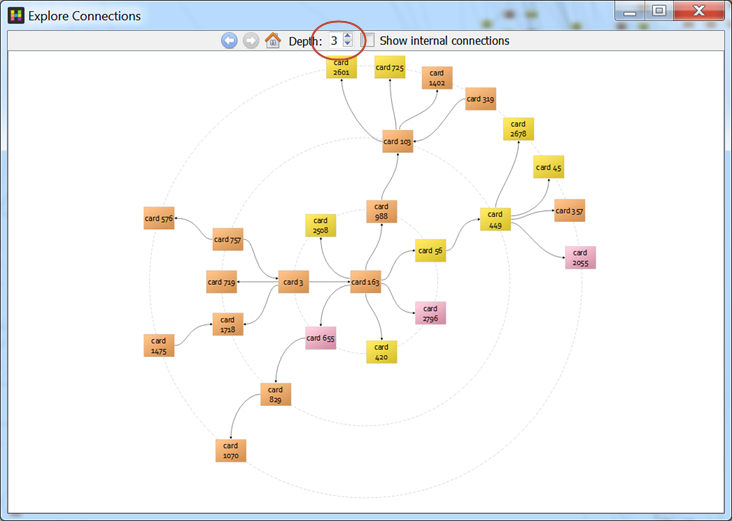
Check Show internal connections if you want to show connections between cards in the same ‘ring’.
You can see tooltips by hovering over a card if View>Card Tool Tips is checked in the main menu.
Press the Escape key to close the window.
Propagating properties along connections
Hyper Plan can propagate numerical property values along connections.
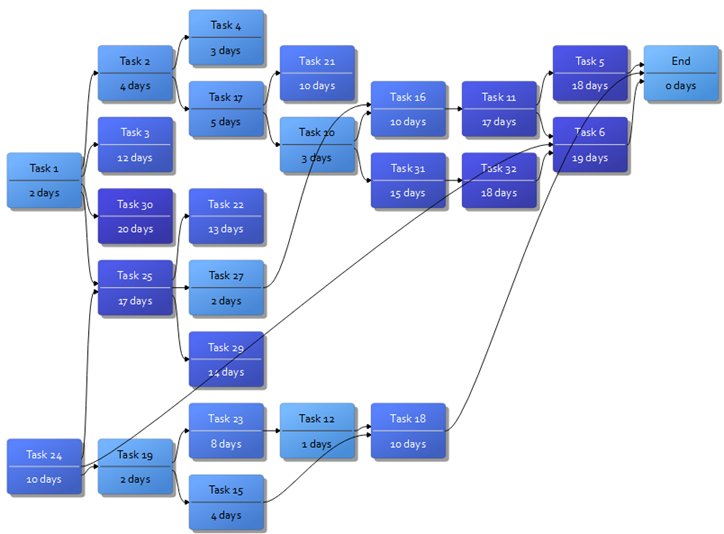
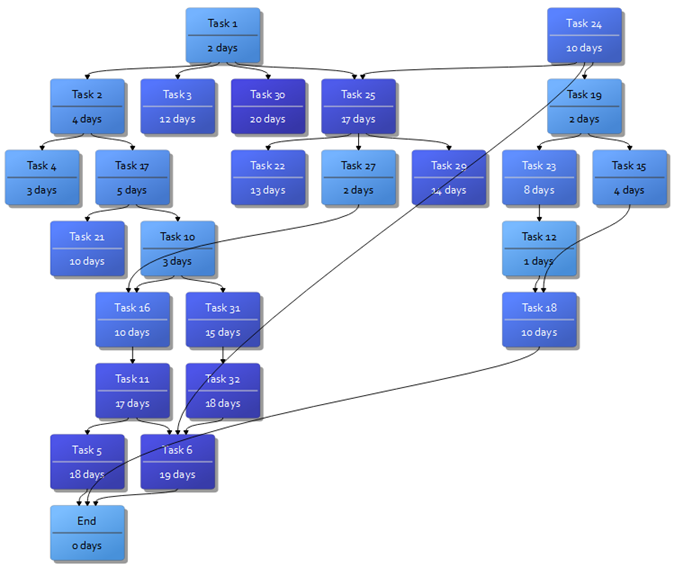
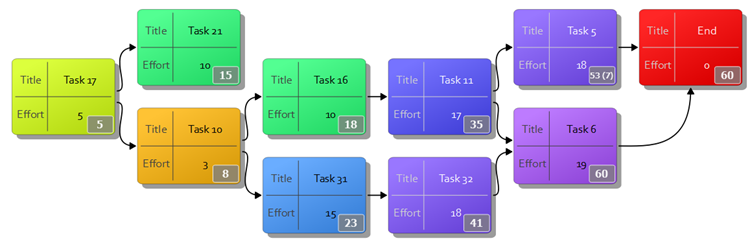
Propagating the maximum along ‘before’ or ‘predecessor’ connections can be used in PERT type scheduling to work out how much time is required to complete a series of inter-dependent tasks. E.g. In the example below, tasks 21 and 10 can be carried out at the same time, but task 17 has to be completed before either can be started. Propagating effort along the connections shows that the tasks will take a total of 60 days.
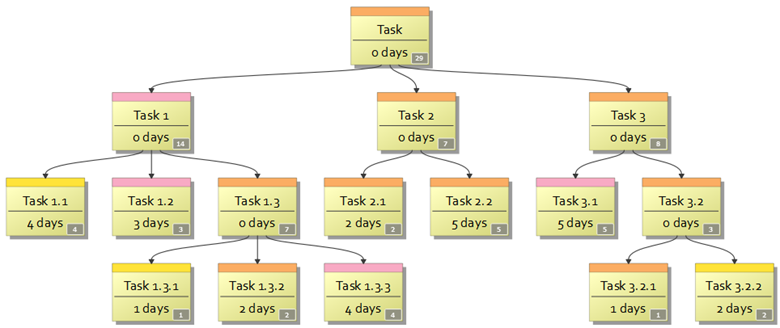
Propagating the sum along ‘comprises’ connections can be used when creating a work breakdown structure, to sum the total effort required for all the sub-tasks.
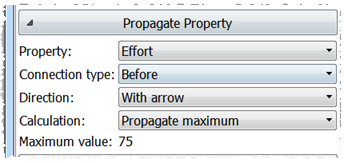
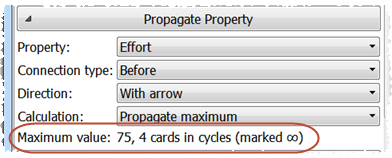
To propagate a value choose: a numerical property to be propagated, the connection type to propagate along, the direction of propagation and the type of calculation.
The propagated value for each card can be calculated as:
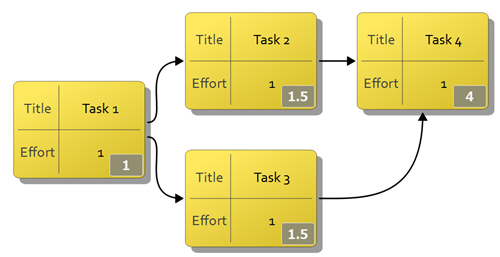
- Propagate maximum: The value for that card, plus the maximum value for the other cards it has incoming connections from. The float/slack is shown in brackets.
- Propagate sum: The value for that card, plus the sum of other cards it has incoming connections from.
- Propagate minimum: The value for that card, plus the minimum value for the other cards it has incoming connections from.
If a card has multiple outgoing connections and the sum is being propagated, then the value propagated is shared equally along each outward connection. Otherwise the same value would be counted multiple times.
It isn’t possible to propagate values where there are cycles in your connections (e.g. A->B->C->A). Cycles are shown with the infinity symbol ∞.
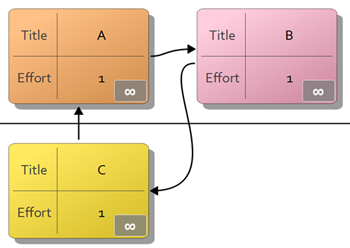
The maximum propagated value of any card in the plan is shown in the Maximum value field. Cycles are also reported on.
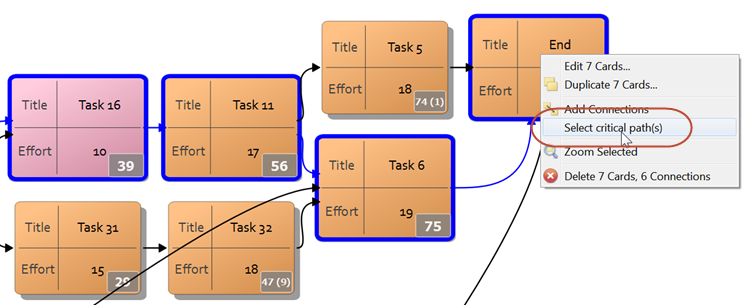
If you are propagating a value using Accumulate maximum you can calculate the critical path to any card by right clicking on that card and selecting Select critical path(s).
Importing and exporting connections
Connections can be exported to and imported from a CSV file along with cards. Each type of connection is shown in a separate column and references the connected cards using a 0 based index.
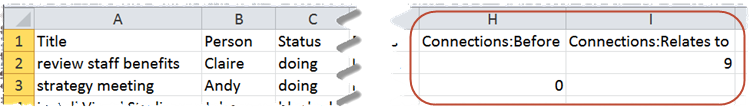
In the above example the ‘strategy meeting’ card has an outgoing ‘Before’ connection to the card with index 0 (‘review staff benefits’).
Excel is a registered trademark of Microsoft Corporation